Hey there, basketball fans—or maybe you’re just curious about the guy whose name pops up every time someone talks about the greatest of all time. I’m talking about Michael Jordan Career Stats, the Air Jordan himself. If you’ve ever watched a slam dunk that made your jaw drop or heard stories about a player who seemed superhuman on the court, you’ve probably got MJ on your mind. His career wasn’t just about winning games; it was about redefining what it means to play basketball. And today, we’re diving deep into his career stats—the numbers that tell the story of a kid from North Carolina who became a global icon.
What makes Jordan’s stats so special? They’re not just cold figures on a page; they’re proof of his relentless drive, his clutch moments, and his ability to elevate everyone around him. Whether you’re a kid dreaming of making your high school team or an adult reliving the glory days of the Chicago Bulls, these stats are easy to grasp. We’ll break them down season by season, highlight the peaks, and even throw in a full table so you can see it all at a glance. By the end, you’ll understand why Jordan’s numbers aren’t just impressive—they’re legendary. Let’s jump in!
From Tar Heels to the NBA: Jordan’s Early Days
Before we get to the nitty-gritty stats, let’s set the scene. Michael Jordan was born in Brooklyn, New York, in 1963, but he grew up in Wilmington, North Carolina. As a high school sophomore, he got cut from the varsity team—not exactly the start of a fairy tale. But MJ? He didn’t quit. He hit the gym harder, grew a few inches, and by his senior year, he was a standout.
College at the University of North Carolina was where the magic started. In 1982, as a freshman, Jordan hit the game-winning shot in the NCAA Championship against Georgetown. His college stats? Solid but not yet superstar level: about 17.7 points per game over three seasons. He averaged 13.4 rebounds as a freshman—talk about hustle! But everyone knew he was NBA-bound. The Chicago Bulls drafted him third overall in 1984. Little did they know, they were getting the future face of basketball.
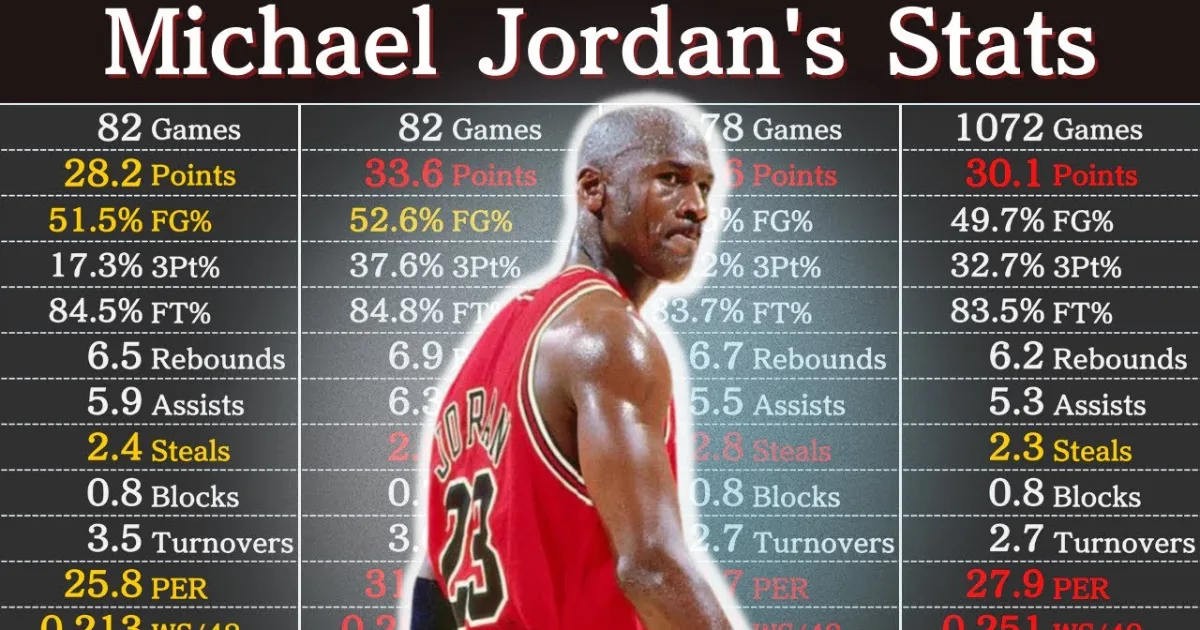
Jordan’s rookie year in 1984-85 was electric. He exploded for 28.2 points per game, earning Rookie of the Year honors. The Bulls weren’t contenders yet—they won just 38 games—but MJ was already a scoring machine. He dunked on everyone, stole the show at the Slam Dunk Contest, and made fans fall in love with the league again. Those early years were about building: Jordan led the league in scoring four times in his first seven seasons, but the Bulls kept falling short in the playoffs. It stung, but it fueled him.
Then came 1991. With teammates like Scottie Pippen and a coach in Phil Jackson who preached triangle offense zen, the Bulls clicked. They swept the Lakers in the Finals, and Jordan was named MVP. It was the first of a three-peat. After his dad’s tragic death in 1993, MJ stepped away from basketball to try baseball—a nod to his father’s dreams. He played minor league ball for the Birmingham Barons, hitting .202 with three home runs. Not bad for a basketball guy, right? But the court called him back in 1995, and the second three-peat (1996-98) sealed his dynasty.
His final act? A comeback with the Washington Wizards in 2001-03. At 38 and 40 years old, Jordan still averaged over 20 points a game. He mentored young players and reminded everyone why he was the GOAT. Retiring for good in 2003, he left with six rings, five MVPs, and a legacy that sells shoes to this day. Now, let’s look at those stats that made it all possible.
Breaking Down the Regular Season Stats: Where the Magic Happened
Jordan played 1,072 regular-season games over 15 NBA seasons—13 with the Bulls, two with the Wizards. That’s a ton of hardwood miles! His career averages? A jaw-dropping 30.1 points per game (PPG), which was the highest in NBA history until LeBron James edged it out. He grabbed 6.2 rebounds per game (RPG), dished 5.3 assists per game (APG), and swiped 2.3 steals per game (SPG). Not bad for a 6’6″ shooting guard who was often double-teamed.
What stands out? Jordan’s scoring efficiency. He shot 49.7% from the field—meaning nearly half his shots went in—and 32.7% from three-point range (back when threes weren’t as trendy). His free-throw percentage was a steady 83.5%, clutch as ever. He played 38.3 minutes per game (MPG), showing his ironman stamina. And those steals? He led the league three times, proving he was a defensive pest too.
But averages only tell part of the story. Jordan had seasons where he was unstoppable. In 1986-87, his sophomore slump? Nah—he dropped 37.1 PPG, the highest in the league. Imagine a 23-year-old averaging that! Fast-forward to 1995-96, post-baseball break: 30.4 PPG on a 72-10 Bulls team that set the regular-season wins record (tied until the Warriors broke it). Even in his Wizards days, when his body wasn’t as fresh, he posted 22.9 PPG in 2002-03. That’s like Tom Brady throwing touchdowns at 45.
Rebounds and assists show his all-around game. Early on, he was a rebounding beast—peaking at 8.0 RPG in 1984-85. As the Bulls got better, he focused more on playmaking, hitting 8.0 APG in 1988-89. Blocks? 0.8 per game career, but he once led guards in that stat. Jordan wasn’t just a scorer; he was a winner who did whatever it took.
One fun stat: He scored 10 or more points in 866 straight games—a streak that screams consistency. And his player efficiency rating (PER)? A league-record 27.9. For context, anything over 25 is elite. MJ lived there.
The Full Regular Season Stats Table: See It All in One Place
To make this super easy, here’s a complete table of Jordan’s regular-season stats, season by season. I’ve kept it straightforward: year, team, games played (G), minutes (MP), points (PTS), rebounds (TRB), assists (AST), steals (STL), blocks (BLK), field goal percentage (FG%), three-point percentage (3P%), free throw percentage (FT%), and points per game (PPG). Bold numbers show where he led the league. This way, you can scan for your favorite era or just geek out on the totals at the bottom.
| Season | Team | G | MP | PTS | TRB | AST | STL | BLK | FG% | 3P% | FT% | PPG |
|---|---|---|---|---|---|---|---|---|---|---|---|---|
| 1984-85 | CHI | 82 | 38.3 | 2313 | 656 | 481 | 196 | 65 | .515 | .173 | .845 | 28.2 |
| 1985-86 | CHI | 18 | 31.9 | 632 | 125 | 53 | 64 | 31 | .457 | .000 | .840 | 35.0 |
| 1986-87 | CHI | 82 | 40.4 | 3041 | 442 | 456 | 251 | 107 | .500 | .182 | .841 | 37.1 |
| 1987-88 | CHI | 82 | 40.4 | 2868 | 587 | 520 | 263 | 81 | .535 | .132 | .841 | 35.0 |
| 1988-89 | CHI | 81 | 40.2 | 2633 | 659 | 650 | 208 | 52 | .538 | .276 | .851 | 32.5 |
| 1989-90 | CHI | 82 | 39.0 | 2753 | 631 | 517 | 208 | 33 | .526 | .376 | .848 | 33.6 |
| 1990-91 | CHI | 82 | 37.0 | 2588 | 509 | 453 | 208 | 34 | .534 | .352 | .851 | 31.5 |
| 1991-92 | CHI | 82 | 38.8 | 2521 | 579 | 483 | 191 | 43 | .519 | .270 | .832 | 30.1 |
| 1992-93 | CHI | 78 | 39.3 | 2592 | 592 | 493 | 181 | 35 | .495 | .352 | .837 | 32.6 |
| 1994-95 | CHI | 17 | 32.6 | 556 | 110 | 32 | 33 | 14 | .465 | .500 | .860 | 32.7 |
| 1995-96 | CHI | 82 | 37.7 | 2491 | 474 | 380 | 202 | 44 | .495 | .427 | .828 | 30.4 |
| 1996-97 | CHI | 82 | 37.5 | 2431 | 456 | 352 | 202 | 44 | .489 | .378 | .833 | 29.6 |
| 1997-98 | CHI | 82 | 38.8 | 2357 | 437 | 292 | 143 | 26 | .465 | .238 | .784 | 28.7 |
| 2001-02 | WAS | 60 | 34.9 | 1346 | 428 | 285 | 87 | 31 | .437 | .189 | .789 | 22.5 |
| 2002-03 | WAS | 82 | 35.3 | 1627 | 444 | 303 | 87 | 32 | .445 | .300 | .821 | 19.8 |
| Career | 1072 | 38.3 | 32292 | 6635 | 5633 | 2514 | 893 | .497 | .327 | .835 | 30.1 |
(Data sourced from NBA.com and Basketball-Reference.com)
Look at that career total: 32,292 points! That’s fifth all-time now, but when he retired, it was tops. Notice the dips? In 1985-86, he played only 18 games due to a foot injury—still averaged 35 PPG. And his Wizards years show father time creeping in, but he never mailed it in. This table is your cheat sheet to MJ’s journey.
Playoff Glory: Where Jordan Shined Brightest
Regular season stats are cool, but playoffs? That’s where legends are made. Jordan played 179 playoff games, averaging 33.4 PPG—the highest ever. He dropped 6.4 RPG, 5.7 APG, and 2.1 SPG. The Bulls went 119-60 with him in the postseason, winning six championships.
His playoff peaks are insane. In 1989, he dropped 39.6 PPG against the Cavs, including “The Shot” over Craig Ehlo. But the Finals? In 1993, he torched the Suns for 41.0 PPG over six games. In 1997, facing trash-talking trash from the Jazz, he hit the iconic jumper over Bryon Russell for the title—five points shy of his 38.5 PPG average that series.
Efficiency held up: 48.7% FG, 33.2% from three. He played 41.4 MPG, often carrying the load. And steals? 376 career playoff swipes. Jordan didn’t just play playoffs; he owned them. Six Finals MVPs prove it. No one else has more than three.
Awards and Accolades: The Hardware That Backs the Stats
Stats are numbers, but awards make them shine. Jordan snagged five regular-season MVPs (1988, 1991-92, 1996, 1998), tying Kareem Abdul-Jabbar for the most. He was a 14-time All-Star, 10-time scoring champ (a record), and nine-time All-Defensive First Team (tied record). In 1988, he won Defensive Player of the Year while leading in steals and scoring—a feat unmatched.
Six championships, six Finals MVPs. Rookie of the Year. Hall of Fame in 2009 (individual) and 2010 (Dream Team). The NBA MVP trophy is named after him now. These aren’t random; they’re tied to those stats. His 30.1 PPG? Led to scoring titles. His defense? All-Defensive nods.
Why These Stats Still Matter Today
Flash forward to 2025: Michael Jordan Career Stats hold up. LeBron passed his scoring total, but MJ’s playoff average? Untouchable. In an era of positionless ball and analytics, Jordan’s PER and true shooting percentage (56.9% career) scream efficiency. He changed the game—globalized it, marketed it, won with style.


